Table of Contents
Decibel Chart: A Key Tool for Interpreting Sound Intensity
- Sophia
- Oct 18, 2025
Introduction
Sound is ubiquitous in our daily lives. From gentle music to roaring factories, the intensity and nature of sound constantly impact our lives and work. Understanding and interpreting sound intensity, particularly using a decibel chart, can help us better understand environmental noise and audio quality, thereby minimizing our hearing and health.
This article will delve into various aspects of the decibel chart, including its definition, structure, applications, and safety precautions. Let's uncover the secrets of the world of sound!
Part 1: What is a decibel?
1.1 Definition of a decibel
The decibel (dB) is a logarithmic unit that describes sound intensity and signal strength. Because sound pressure and power often have an exponential relationship, the decibel more intuitively represents this nonlinear perception. Therefore, we use the decibel unit rather than directly using frequency or sound pressure values.
1.2 Basic Units of Sound
In sound measurement, decibels are typically expressed relative to a reference value. The most common sound pressure level is 20 micropascals (μPa), the lowest sound level audible to the human ear. The formula for calculating sound pressure level (SPL) is:
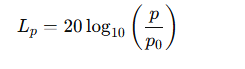
Where:
Lₚ is the sound pressure level (measured in dB);
p is the measured sound pressure;
p₀ is the reference sound pressure (20 μPa).
1.3 The Meaning of Decibel Values
It is important to understand the relative value of decibels. Below are a few common examples of sound pressure levels:
0 dB: The threshold of hearing, a sound that is barely audible.
30 dB: A quiet library.
60 dB: Normal conversation.
85 dB: Long-term exposure may cause hearing damage.
100 dB: Motorcycle noise; short-term exposure requires caution.
120 dB: The pain threshold, which may cause immediate hearing damage.
Part II: Basic Structure of a Decibel Chart
2.1 Structure of a Decibel Chart
Decibel charts are typically two-dimensional, where:
The vertical axis represents the sound pressure level in dB, typically arranged from low to high.
The horizontal axis can represent time, frequency, or the location of different measurement points. Different chart types use different horizontal axis representations.
2.2 Common Types of Decibel Charts
Sound pressure level charts: These display changes in sound pressure at different measurement points or over time and are the most common type of decibel chart.
Frequency response charts: These charts show the sensitivity of audio equipment at different frequencies to evaluate its performance.
Noise monitoring charts: These charts are used to analyze ambient noise, helping to identify noise sources and assess their impact.
2.3 How to Interpret a Decibel Chart
By analyzing a decibel chart, we can obtain the following information:
Sound pressure level: Higher dB values generally indicate louder sounds and are more likely to cause hearing damage.
Time variation: The horizontal axis shows how sound changes over time, such as when peak sound pressure occurs.
Frequency analysis: A frequency response chart can clearly show which frequencies a device performs well at and which frequencies may experience significant attenuation.
Part III: Practical Applications of Decibel Charts
3.1 Audio Engineering
In audio production, recording, and live sound, decibel charts are widely used to adjust volume and optimize audio performance. Sound engineers can adjust microphone sensitivity, speaker output, and other parameters based on the decibel level to achieve optimal listening experience.
3.2 Noise Monitoring and Environmental Protection
Urban noise pollution is a significant issue facing modern society. Using decibel charts, environmental protection departments can monitor sound pressure levels in various urban areas, identify noise sources, and assess their impact on residents' lives, thereby formulating appropriate noise control measures.
3.3 Personal Health and Safety
Noise control in the workplace is crucial. Occupational health and safety departments can use decibel charts to monitor noise levels and ensure a safe working environment. When noise levels exceed 85 dB, wearing hearing protection is recommended to prevent hearing loss.
3.4 Academic Research
In scientific research, particularly in fields such as acoustics and environmental science, researchers often use decibel charts to analyze sound wave propagation characteristics and the ecological impact of noise. This quantitative approach makes research findings more convincing.
Part 4: Health Impacts of Noise
4.1 Short-Term and Long-Term Impacts
The impacts of noise can be categorized as short-term and long-term:
Short-term impacts: High-decibel sounds can cause temporary tinnitus or hearing loss, while prolonged exposure to high-decibel levels can cause mental fatigue and stress.
Long-term impacts: Long-term exposure to noise, such as in industrial and construction environments, increases the risk of chronic hearing loss, cardiovascular disease, and other health problems.
4.2 How to Protect Hearing
As awareness of the hazards of noise in the workplace increases, hearing protection measures have become increasingly important:
Wearing earmuffs or earplugs:
In high-noise environments, wearing appropriate hearing protection is crucial.
If you are using the explanation equipment during the factory tour, I recommend wearing professional noise-canceling headphones to reduce the damage to your ears. For example, the Retekess TT034 noise-canceling headphones
Regular hearing tests:
Regular hearing tests can help detect potential hearing damage early, allowing for timely action.
Part 6: Safety and Health Considerations
6.1 Noise Identification and Classification
For different types of noise (such as machinery noise and traffic noise), it is necessary to identify their characteristics and intensity to avoid indiscriminate exposure to high noise levels.
6.2 Developing a Noise Management Plan
Developing a noise management plan in the workplace is an effective way to ensure employee safety. This includes noise monitoring, training, and clear safety measures such as the use of earplugs.
6.3 Advocacy and Enhanced Education
Raising awareness of noise and its impacts, and further educating employees about noise hazards and prevention measures, are crucial components of protecting hearing and health.
Conclusion
By understanding the decibel chart, we can not only improve our understanding of sound intensity but also take effective measures to protect our hearing and health. Noise pollution is a pervasive problem in modern life, and the appropriate use of the decibel chart can help us better address this challenge.


Comments (0)